이번 분석에서는 지난번에 한 AARRR 분석 중 1. 획득(Acquisition), 2. 활성화(Activation) 를 이어서
3. 유지(Retention) 에 대해 분석해봤다.
지난번에 앞으로 해볼 분석으로 4가지를 정리했는데, 그중에서 1번과 4번을 먼저 해보려고 한다.
1. 재구매까지 걸리는 시간 분석
✔ 신규 고객이 첫 구매 후 몇 일 만에 다시 구매하는가?
4. Cohort 분석 (첫 구매 시점 기준 유지율 분석)
✔ 예: 2017년 1월 신규 고객이 2017년 2월, 3월, 4월에 얼마나 재구매했는가?
지난번 분석 포스팅은 아래 URL!
AARRR 분석 - 3. 유지(Retention) 분석
목표 :
- 고객이 한 번 구매하고 끝나는지, 아니면 꾸준히 재구매하는지 분석하는 단계!
- 이커머스에서는 고객 유지율이 매출 & 성장에 직접적인 영향을 주기 때문에 매우 중요한 지표임!
✅ 이번 분석에서 파악할 내용 :
✔ 재구매까지 걸리는 평균 기간 분석
✔ 고객의 월별 유지율 (Cohort 분석)
1. 재구매까지 걸리는 시간 분석
목표 : 신규 고객이 첫 구매 후 평균적으로 몇 일 만에 다시 구매하는지 분석
-- 1) 각 회원 별 첫 구매일
SELECT customer_unique_id,min(order_purchase_timestamp) first_order
FROM customer
group by customer_unique_id;

-- 2) 각 회원 별 두번째 구매일
-- (첫번째 구매일 추출하여 첫번째 구매일 보다 두번째 구매일이 큰(늦은) 주문만 추출)
SELECT c1.customer_unique_id, MIN(order_purchase_timestamp) sec_order, first_order
FROM customer c1 left join (
	SELECT customer_unique_id, min(order_purchase_timestamp) first_order
	FROM customer
	group by customer_unique_id) c2
on c1.customer_unique_id = c2.customer_unique_id
WHERE order_purchase_timestamp > first_order
GROUP BY c1.customer_unique_id ;

-- 3) 전체 회원의 평균 재구매 기간
WITH first_purchase AS (
	SELECT customer_unique_id, min(order_purchase_timestamp) first_order
	FROM customer
	group by customer_unique_id
),
repeat_purchase AS (
	SELECT c.customer_unique_id, MIN(order_purchase_timestamp) sec_order, first_order
	from customer c left join first_purchase f
	on c.customer_unique_id = f.customer_unique_id
	WHERE order_purchase_timestamp > first_order
	GROUP BY c.customer_unique_id
)

SELECT ROUND(AVG(datediff(SEC_ORDER, FIRST_ORDER)),2)
FROM repeat_purchase;  -- 88.47
/* 첫 구매 후 평균 약 88일 후 재구매*/
1) 각 고객별 첫 구매일 조회
MIN(order_purchase_timestamp)를 사용해서 각 고객의 첫 번째 주문일을 찾는다.
2) 각 고객별 두 번째 구매일 조회
첫 번째 구매일보다 더 늦은 주문들 중에서 최소값을 찾아서 "두 번째 구매일"을 추출
💡 여기서 발견한 점!
- 데이터를 보니까 하루에 2번 주문한 고객도 있음!
- 그래서 두 번째 구매일이 0일(같은 날)로 나오는 경우도 있음
- 만약 이걸 제외하고 분석하려면 날짜에서 시간을 제거한 후, 같은 날짜면 제외하는 방식으로 처리 가능!
- 이번 분석에서는 포함하고 분석 ( 평균 구매일이 짧아질 가능성 있음)
3) 평균 재구매 기간 계산
datediff 이라는 날짜차이계산 함수 이용, avg 로 평균 계산
첫 구매 후 평균 재구매 기간: 88.47일
88일이면 거의 3개월 정도인데 문제가 많다 ㅠㅠㅠㅠ
아무튼 지난번 부터 내 회사도 아닌데 속상하다ㅋㅋㅋ
2. 고객의 월별 유지율 분석 (Cohort 분석)
목표
- Cohort 기준 → 고객을 첫 구매 시점(년-월) 기준으로 그룹화
- 각 Cohort(고객 그룹)가 첫 구매 후 1개월 ~ 6개월 동안 얼마나 재구매하는지 분석
1) Cohort 분석 SQL
-- 코호트분석
/* Cohort 기준 → 고객별 첫 구매 시점(년-월) 기준으로 그룹화
   재구매 분석 방법 → 첫 구매 후 1개월 ~ 6개월 후까지 재구매 여부 확인
   비교 포인트 → Cohort별로 재구매율이 어떻게 변화하는지 확인 */

with cohort as (
	select c1.customer_unique_id,
		date_format(first_order,'%Y-%m') cohort_month,
		date_format(order_purchase_timestamp,'%Y-%m') order_month,
		timestampdiff(month,first_order,order_purchase_timestamp) month_diff
	from customer c1 left join (
		select customer_unique_id,min(order_purchase_timestamp) first_order
		from customer
		group by customer_unique_id ) c2
	on c1.customer_unique_id=c2.customer_unique_id
	where  order_purchase_timestamp >= first_order
)

select cohort_month,
    -- month_diff, count(distinct customer_unique_id)
    count(distinct case when month_diff = 0 then customer_unique_id end ) as '0개월후',
    count(distinct case when month_diff = 1 then customer_unique_id end ) as '1개월후',
    count(distinct case when month_diff = 2 then customer_unique_id end ) as '2개월후',
    count(distinct case when month_diff = 3 then customer_unique_id end ) as '3개월후',
    count(distinct case when month_diff = 4 then customer_unique_id end ) as '4개월후',
    count(distinct case when month_diff = 5 then customer_unique_id end ) as '5개월후',
    count(distinct case when month_diff = 6 then customer_unique_id end ) as '6개월후'
from cohort
group by cohort_month
order by cohort_month;
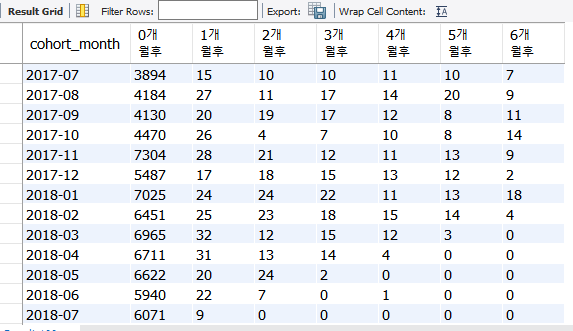
2) Cohort 분석 결과
고객을 첫 구매 시점의 년-월 기준으로 그룹화한 뒤, 각 개월 후 재구매율을 확인!
- 재구매까지 가장 오래 걸린 고객은 20개월 후에도 재구매
- 하지만 1개월 ~ 6개월 후까지만 집중적으로 분석하기로 함
- 지난번에 재구매율이 3%밖에 안 됐기에, Cohort 분석에서도 똑같이 낮게 나타남
이 부분을 비율로 나타내면
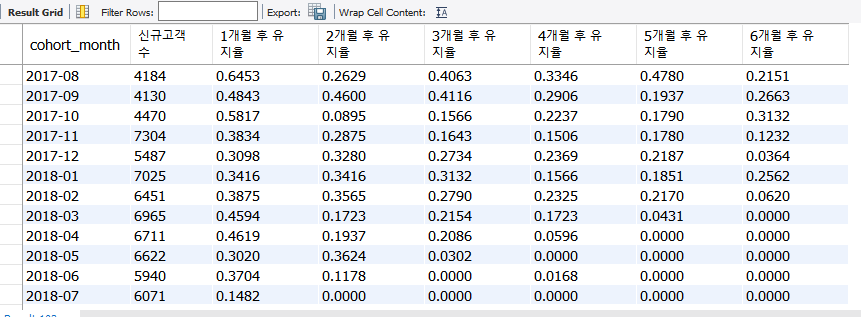
2017년 8월 기준 해석:
- 2017년 8월 신규 고객 = 4,148명
- 1개월 후 재구매 고객 = 27명
- 유지율 = 0.645%
결론 & 인사이트
1. 이커머스 서비스에서 고객 유지율이 심각하게 낮음 (3개월 안에 다 이탈 😭)
2. 평균 재구매 기간이 88일(거의 3개월) → 고객이 이탈하기 전에 재구매를 유도할 전략 필요!
3. 신규 고객 유입은 많지만, 재구매율이 낮아서 매출 성장에 문제 발생 가능!
지난번에 내 블로그 방문자를 기준으로 구글 애널리틱스를 활용하여 코호트 분석을 해 보았는데 이번에는 SQL 을 이용하여 데이터를 직접 전처리 한 후 분석 해 보았다. 자동으로 데이터 생성해주는 구글 애널리틱스의 기능도 물론 너무 유용하지만, 또 데이터를 직접 만져보며 분석 해 보는 방향도 새로웠다.
다음번에는 구매 빈도분석과 구매금액 관련 분석을 진행 해 볼까 한다.
상품 구매 목록 데이터도 있어 상품 별 구매 분석도 가능 할 듯 하다.진짜 데이터 분석의 세계는 끝이없다.
'학습 > 데이터 분석' 카테고리의 다른 글
| [AARRR 분석] 캐글 이커머스 데이터와 SQL로 실습해보기 4 (재구매 분석) (0) | 2025.03.13 |
|---|---|
| [AARRR 분석] 캐글 이커머스 데이터와 SQL로 실습해보기 2 (0) | 2025.03.07 |
| [AARRR 분석] 캐글 이커머스 데이터와 SQL로 실습해보기 1 (1) | 2025.03.07 |
| [AARRR] 분석의 마지막 단계: Revenue(수익)에 대한 지표 알아보기 (ARPU, ARPPU, LTV) (0) | 2025.03.05 |
| [데이터 분석 학습] 구글애널리틱스 이용한 코호트분석 (0) | 2025.03.04 |


